/
Creating a Line Chart Dashboard
Creating a Line Chart Dashboard
- Alex Nyberg
Owned by Alex Nyberg
Last updated: Mar 27, 2017
Intro
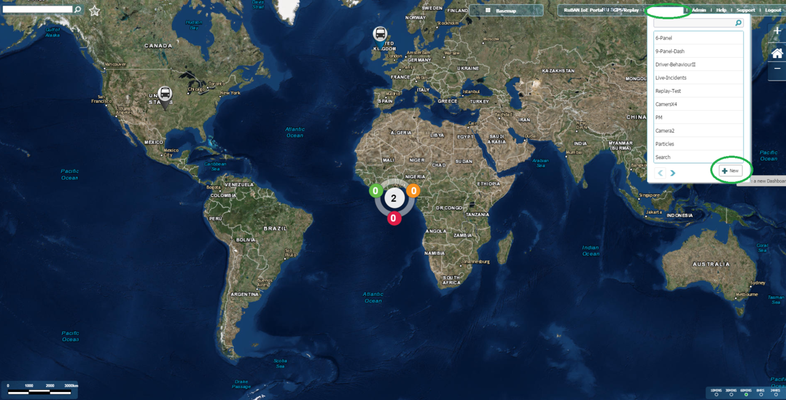
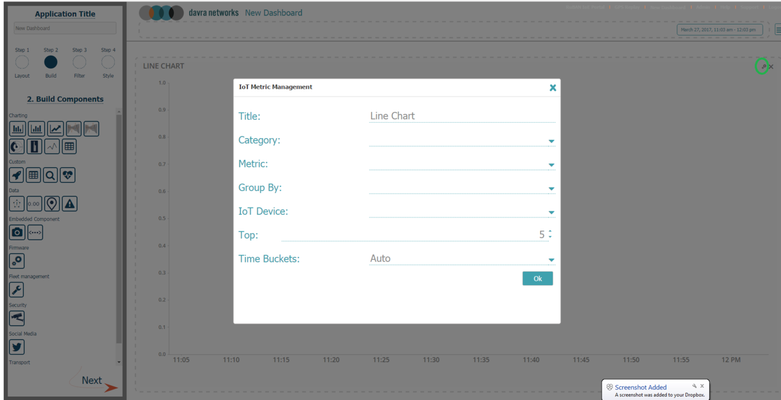
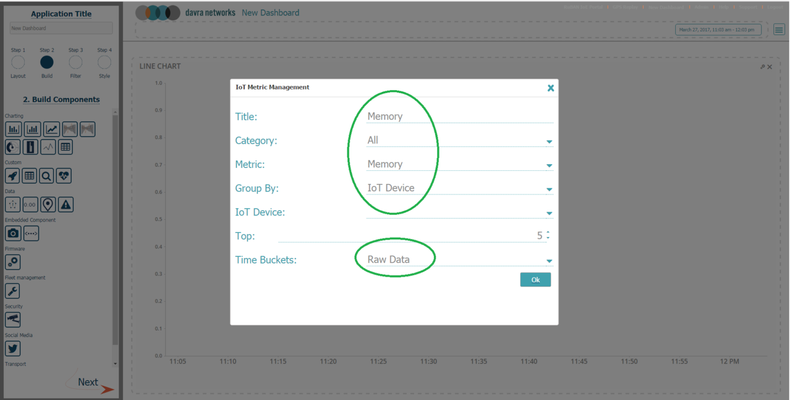
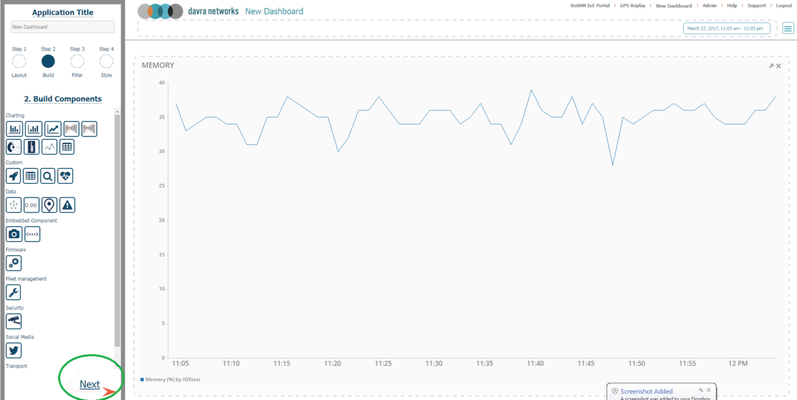
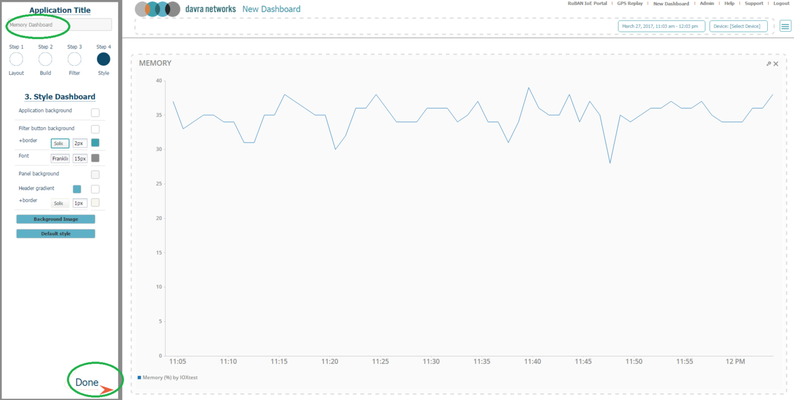
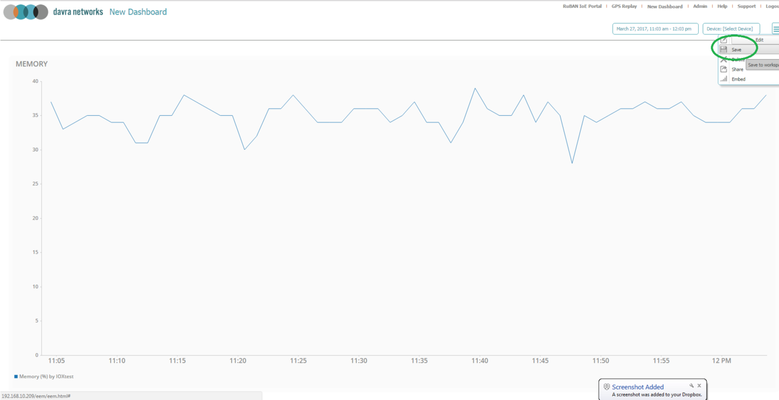
Below screenshots describe the process of creating a dashboard with a Line Chart displaying the Memory metric value in raw format.
The same process works for any other metrics.
Prerequisites
If you want to display metrics which are not defined by default in RuBAN (Admin → Metric Configuration) you will need to create and upload appropriate metric definitions.
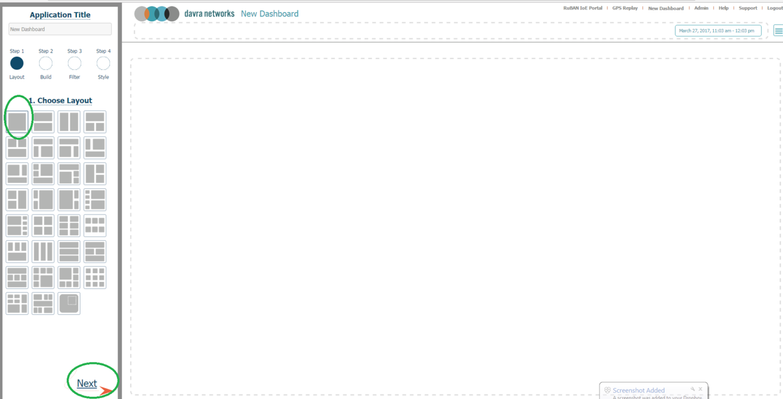
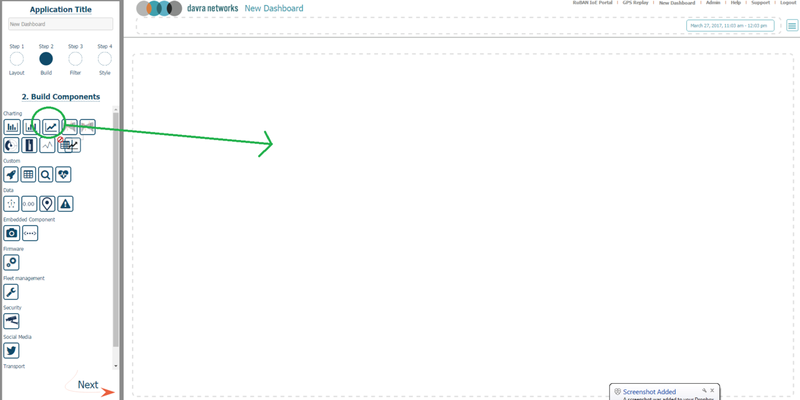
Instructions
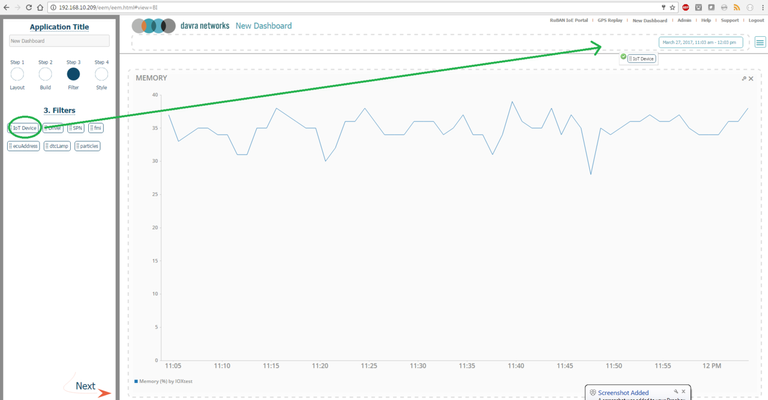
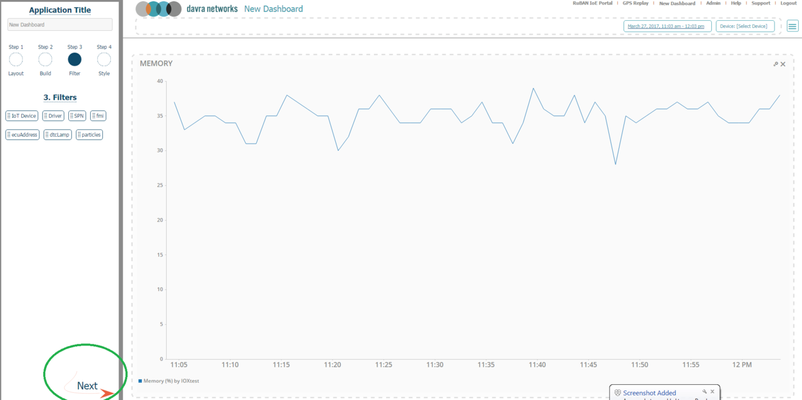
, multiple selections available,
Related content
Creating custom dashboard panels
Creating custom dashboard panels
More like this
Add a pop-out dimension chart to the map
Add a pop-out dimension chart to the map
More like this
Metric Definitions
Metric Definitions
More like this
Quick-start guide
Quick-start guide
More like this
Get Sensor Data into your Custom Panel
Get Sensor Data into your Custom Panel
More like this
Design Considerations
Design Considerations
More like this