System Integrator Development Environment
- Joseph Quinn
As a system integrator delivering IoT solutions it is critical that you can quickly adapt and build on top of the RuBAN platform to create the services that the end customer needs. With this in mind, RuBAN comes with a built in IDE or as we call it SIDE (System Integrator Development Environment). If you wish to get your hands dirty with your first flow and an understanding of how this environment works then this article is for you.
A walk-through of the environment:
To open RuBAN SIDE
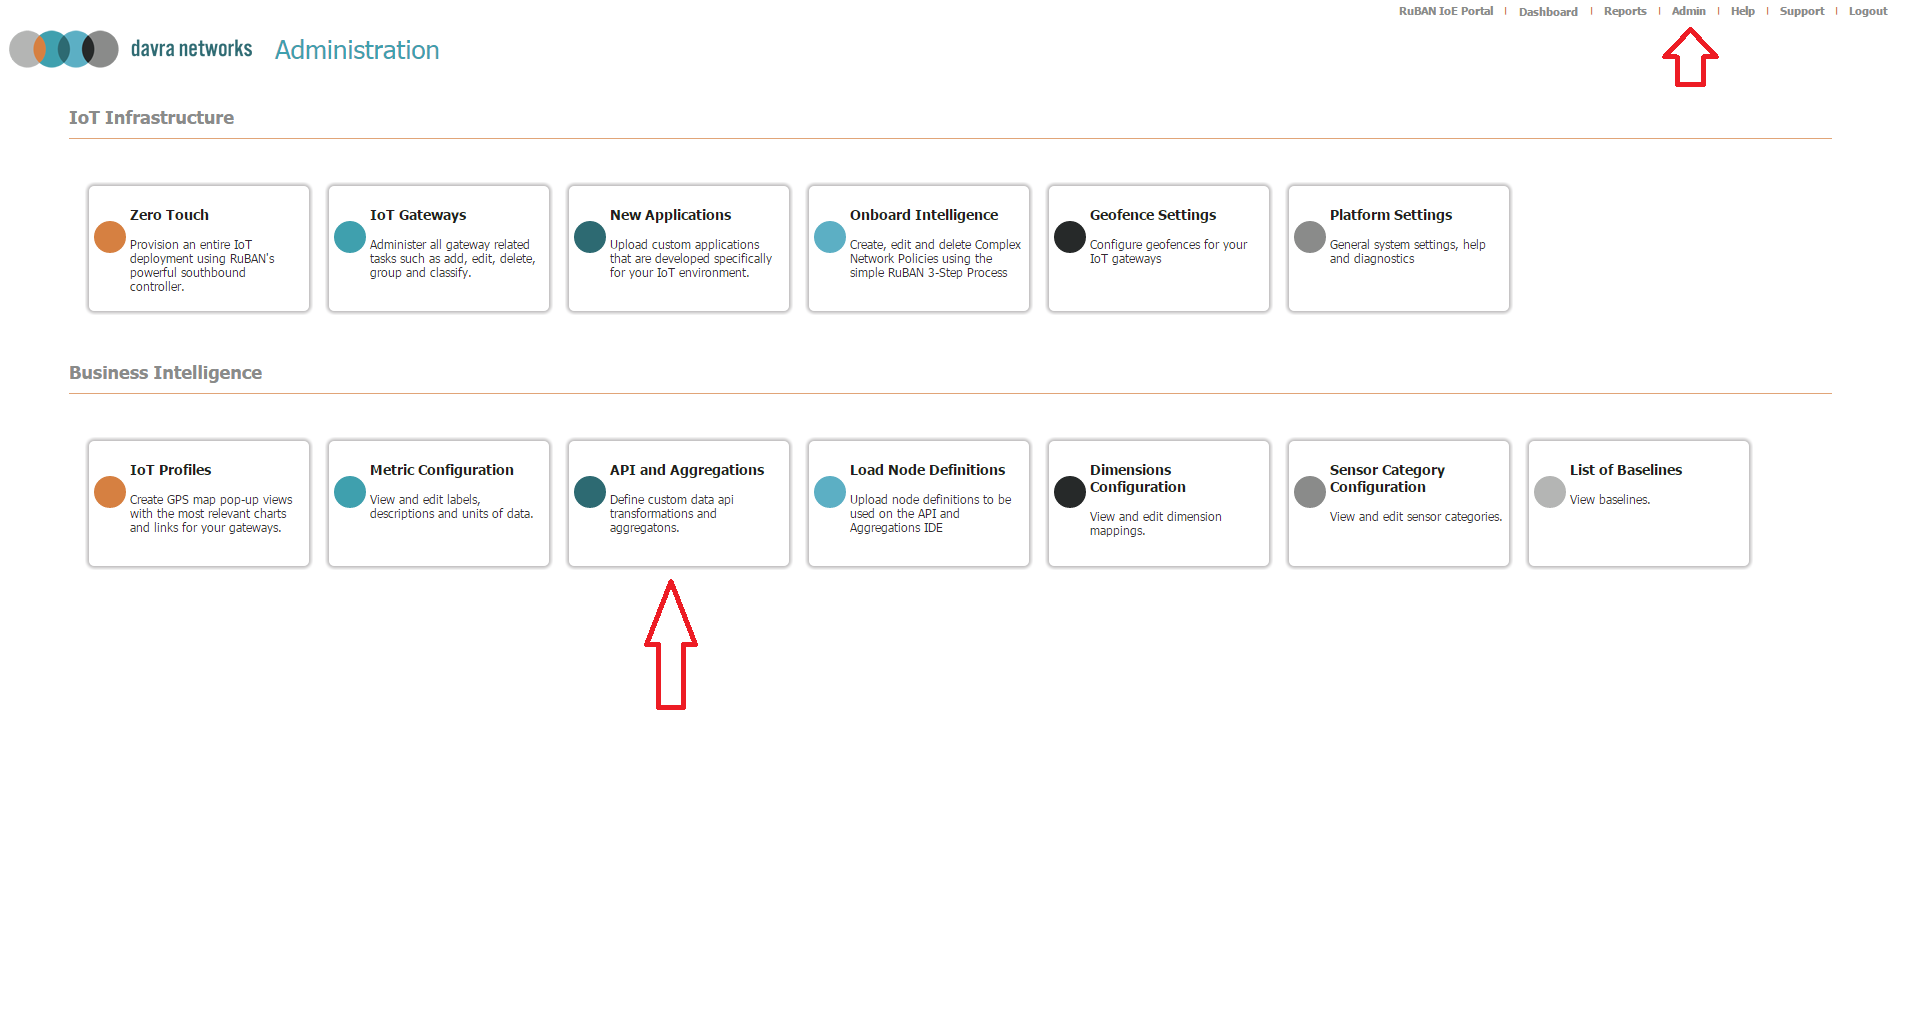
- Once logged in, select Admin from the top right hand corner
- Select API and Aggregations from the list of administrative functions as in the following screenshot:
- You will be brought to the SIDE interface. We will walk you through the various components that make up this interface. First draw your attention to the top left, the nodes that fall under the heading "input".Screenshots of these nodes are below. These are nodes which you will be able to use as input nodes flows. This is for connecting data sources to the RuBAN platform. RuBAN comes with a pre populated list of input nodes but this list can be easily extended to include new inputs should you encounter a new sensor type in the field. For example here you can connect to HTTP web services, UDP data streams, Modbus sensors, AMQP data streams etc.
- If you scroll down you will see output data nodes, this is the reverse of the input nodes in that you can expose data from RuBAN in an output in the format of an output node. For example to create a new API call, a new MQTT topic or even to talk to other legacy systems such as Dot Matrix signage.
- The next section if you scroll down is "function". Typically you don't just take data from an input and redirect to an output, you often need to perform some function over the data. Perhaps combine two sensor values together in a function to create a value that gives the customer the insight they need. There are many building blocks allowing you to inject whatever business logic makes sense into the flow. Such as switch's which can pass data through different paths in a flow, insert delays in the flow and event insert a node which allows you to insert your own code snippet.
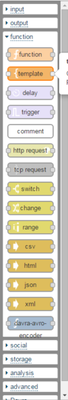
- The next section is social integrations, where you can output data to a twitter feed, and email, even to someone's IM client. RuBAN is designed to integrate easily into the workflow of the user and integrations that can send relevant data to targeted individuals with a well defined action item is a key aspect of the RuBAN platform.
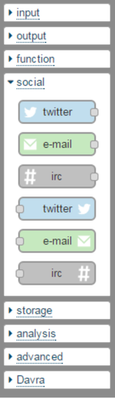
- Continuing down we have storage nodes. These are so RuBAN can dump data out into a different storage mechanism. RuBAN comes with its own built in Big Data NoSQL database but in certain environments it may be requested that RuBAN redirect the data to another storage mechanism also. For this the Storage nodes can be used. RuBAN has used these to perform tasks such as sending data into Cloudera, putting an Impala interface on top of the data and making it accessible from a BI system such as Jaspersoft/Tibco.
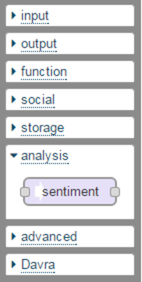
- Analysis nodes are next. This is where analysis can be performed over a real time data stream. An example node is contained which looks at the sentiments of tweets and reports which ones are positive and which are negative but in sensor data contexts you could insert complex event processing, statistical processing or algorithms in line with the flow to execute over the data.
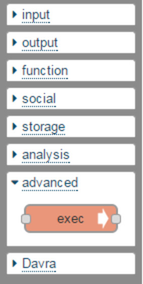
- Advanced comes with a command to execute CLI commands. These could be executed on the RuBAN serv er but when running on an IoT gateway device a CLI command could be run to change configuration or kick off processes running on the gateway device.
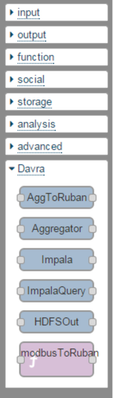
- There is then a Davra category containing some useful nodes which have been added over time to integrate with sensor types, perform useful aggregations over data or integrate with other big data systems.


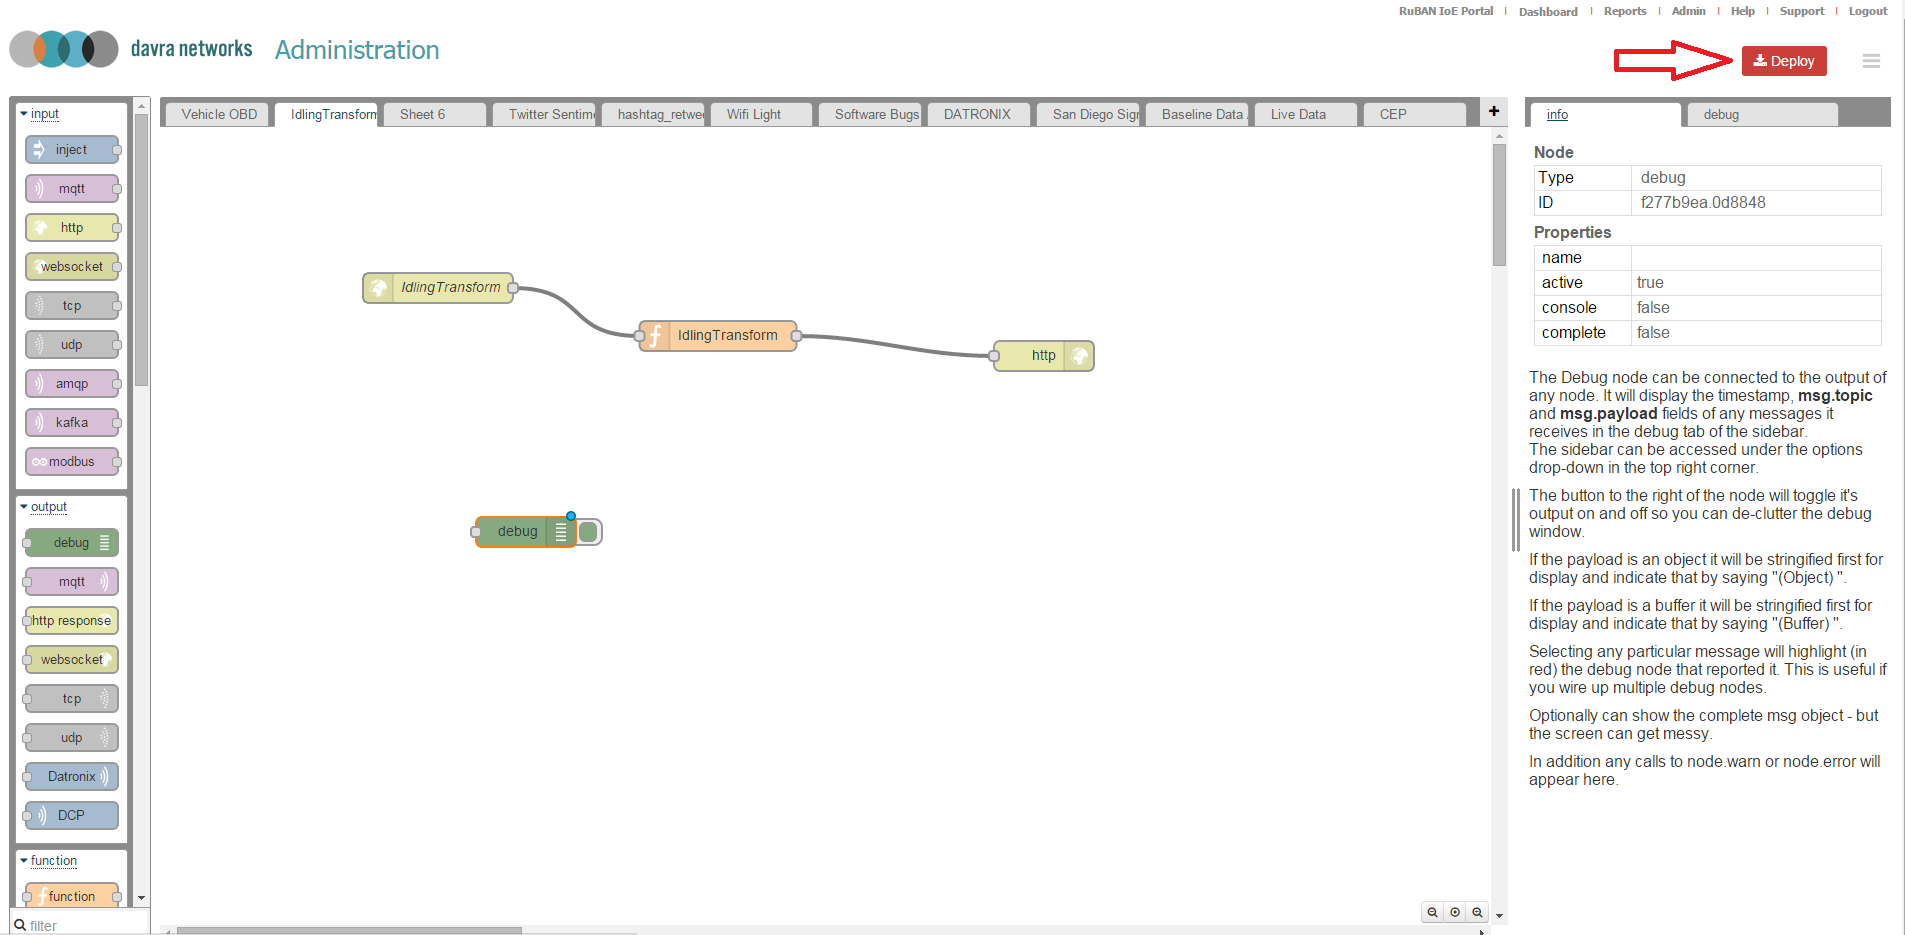
Every node in the IDE is self documenting, drag and drop any node you wish onto the canvas and take notice of the info panel on the right hand side. It will update to be populated with any relevant information needed to a system administrator or developer looking to use this node.
Go ahead and drag and drop any nodes which look interesting to you or even check them all out. Below is a screenshot displaying the HTTP input node:
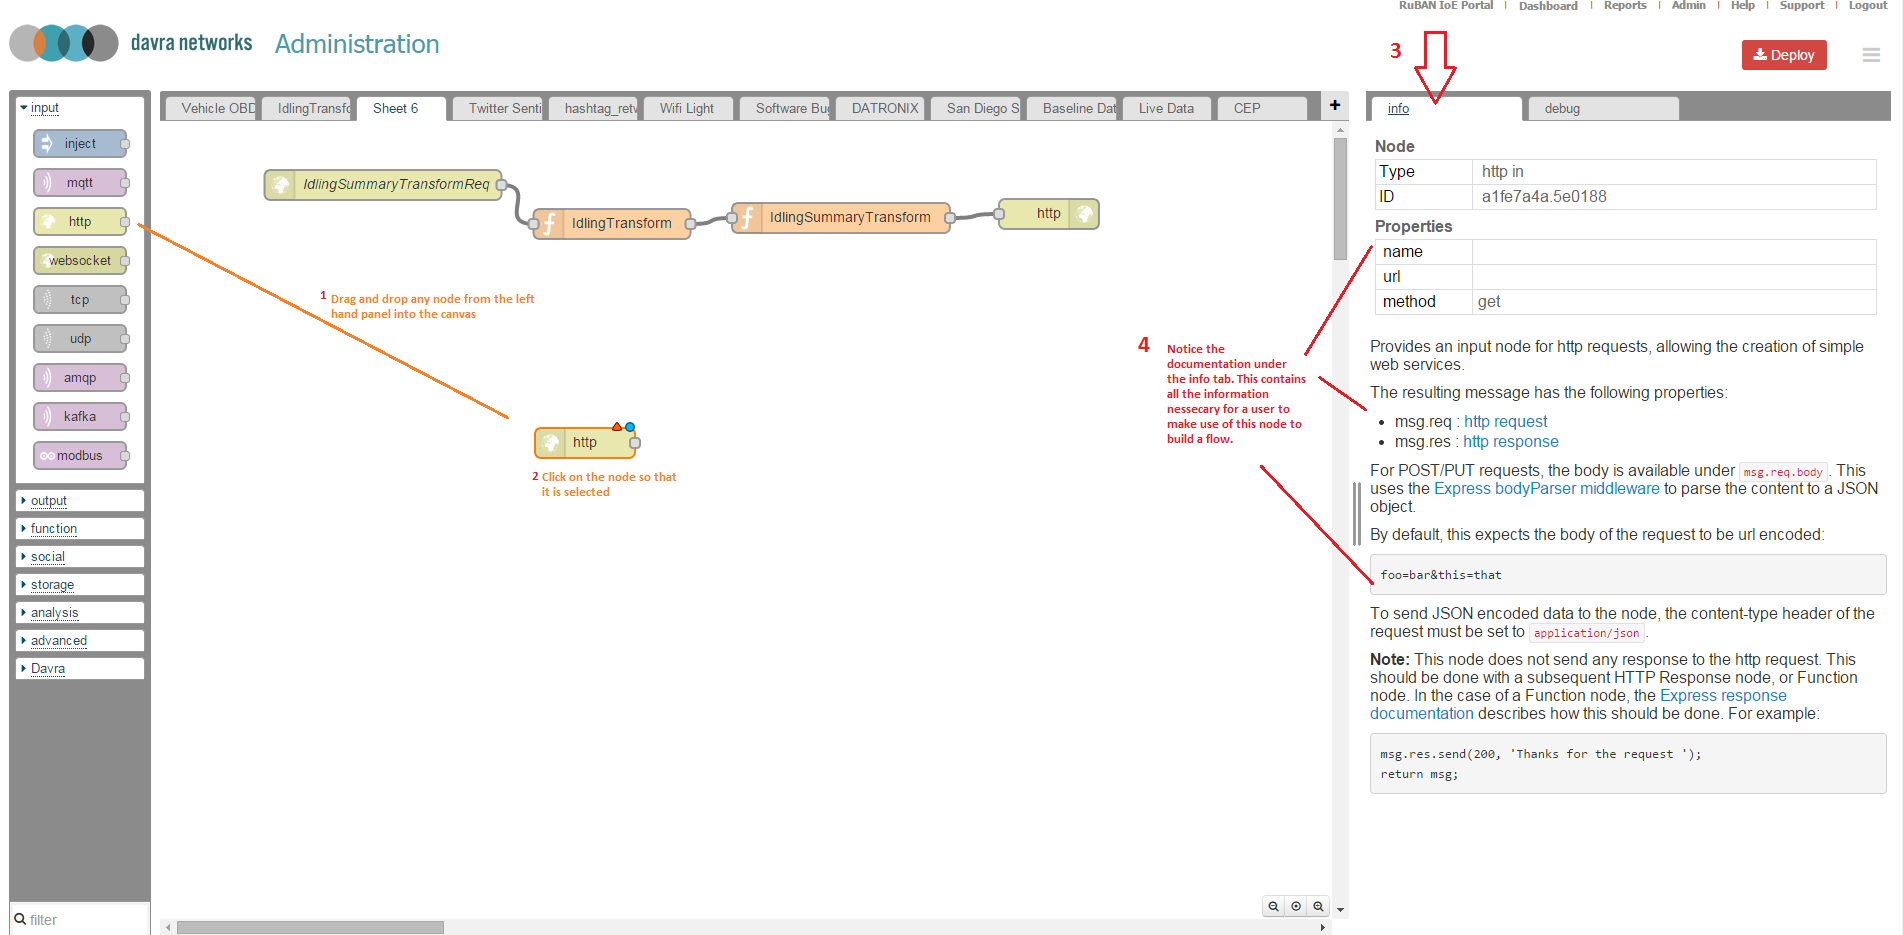
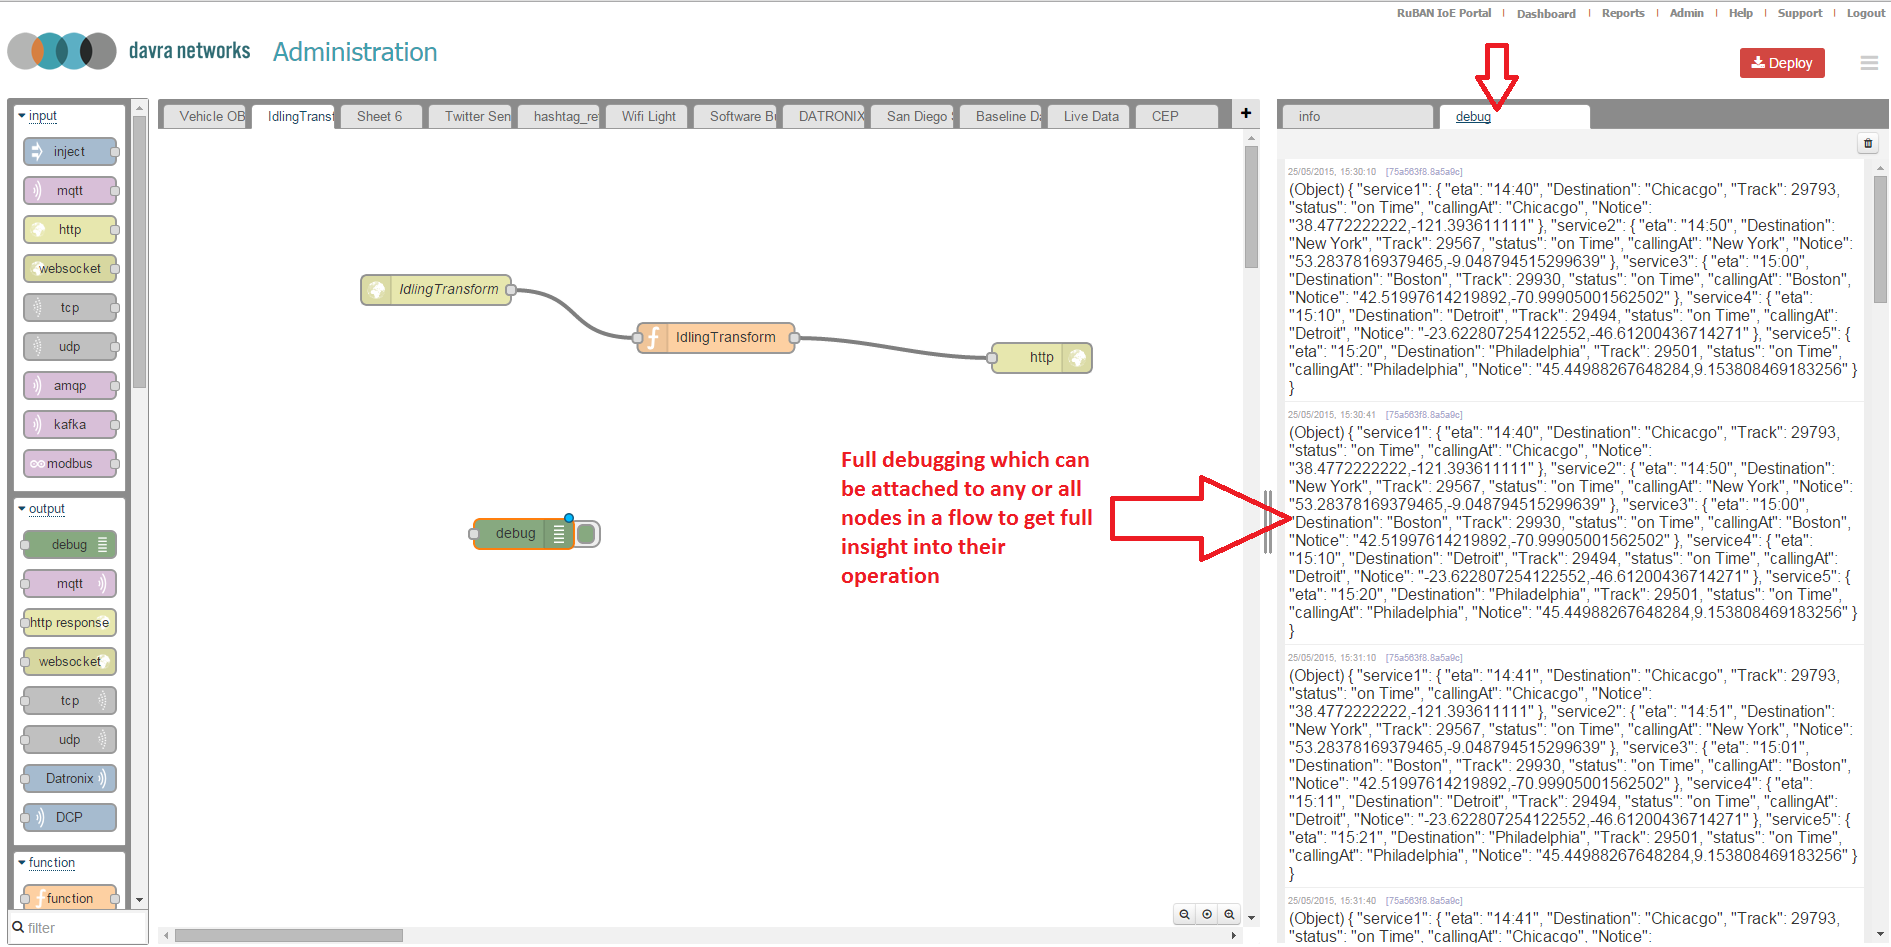
No IDE is complete without debugging tools built in. Any application developer will want to debug to ensure it is giving them the expected results before pushing to production. Switch from the "info" tab to the "debug tab" to view debugging coming from deployed flows.
When you are satisfied that your flow is functioning as intended and want to try it out in production, select the deploy button. Flows can be deployed to the RuBAN server or they can be set to run locally on the intelligent gateway devices.
Creating a simple flow:
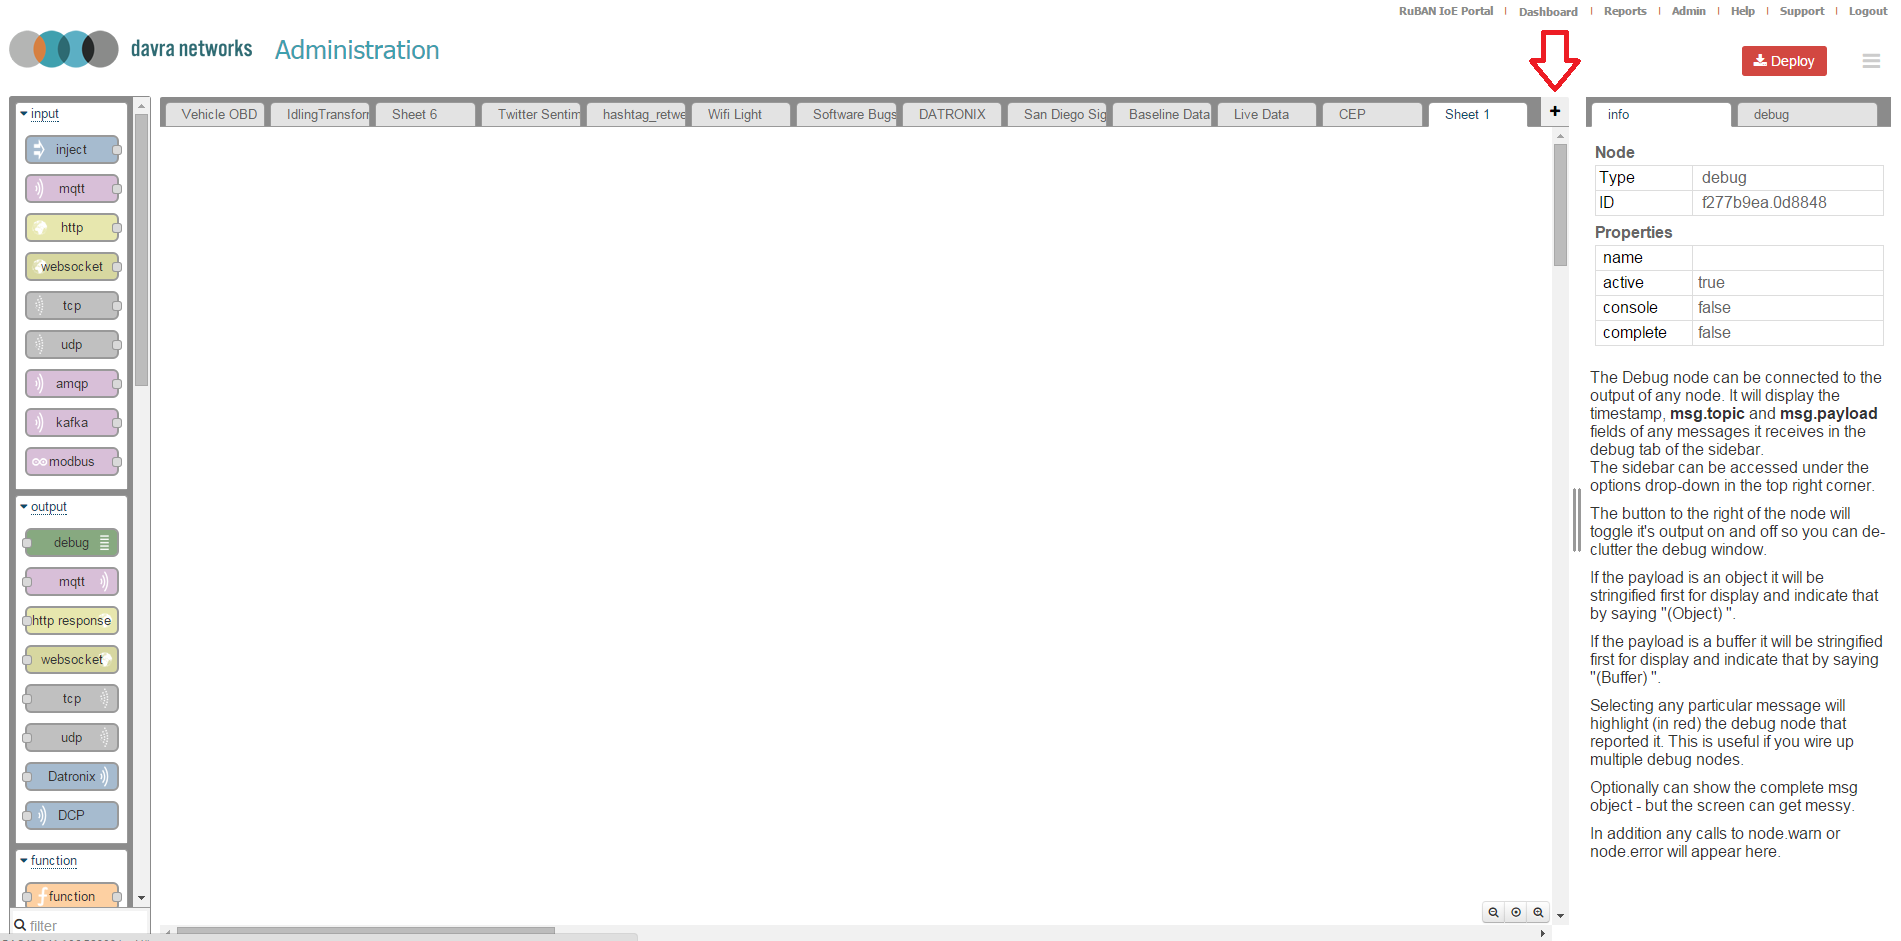
Across the top of the panel you will see a number of tabs. These correspond to sheets. Each sheet can have multiple flows so typically flows that are related to each other are grouped together in a sheet. For this exercise we will create a new sheet. Select the "+" button on the right hand side as marked out in the screenshot below.
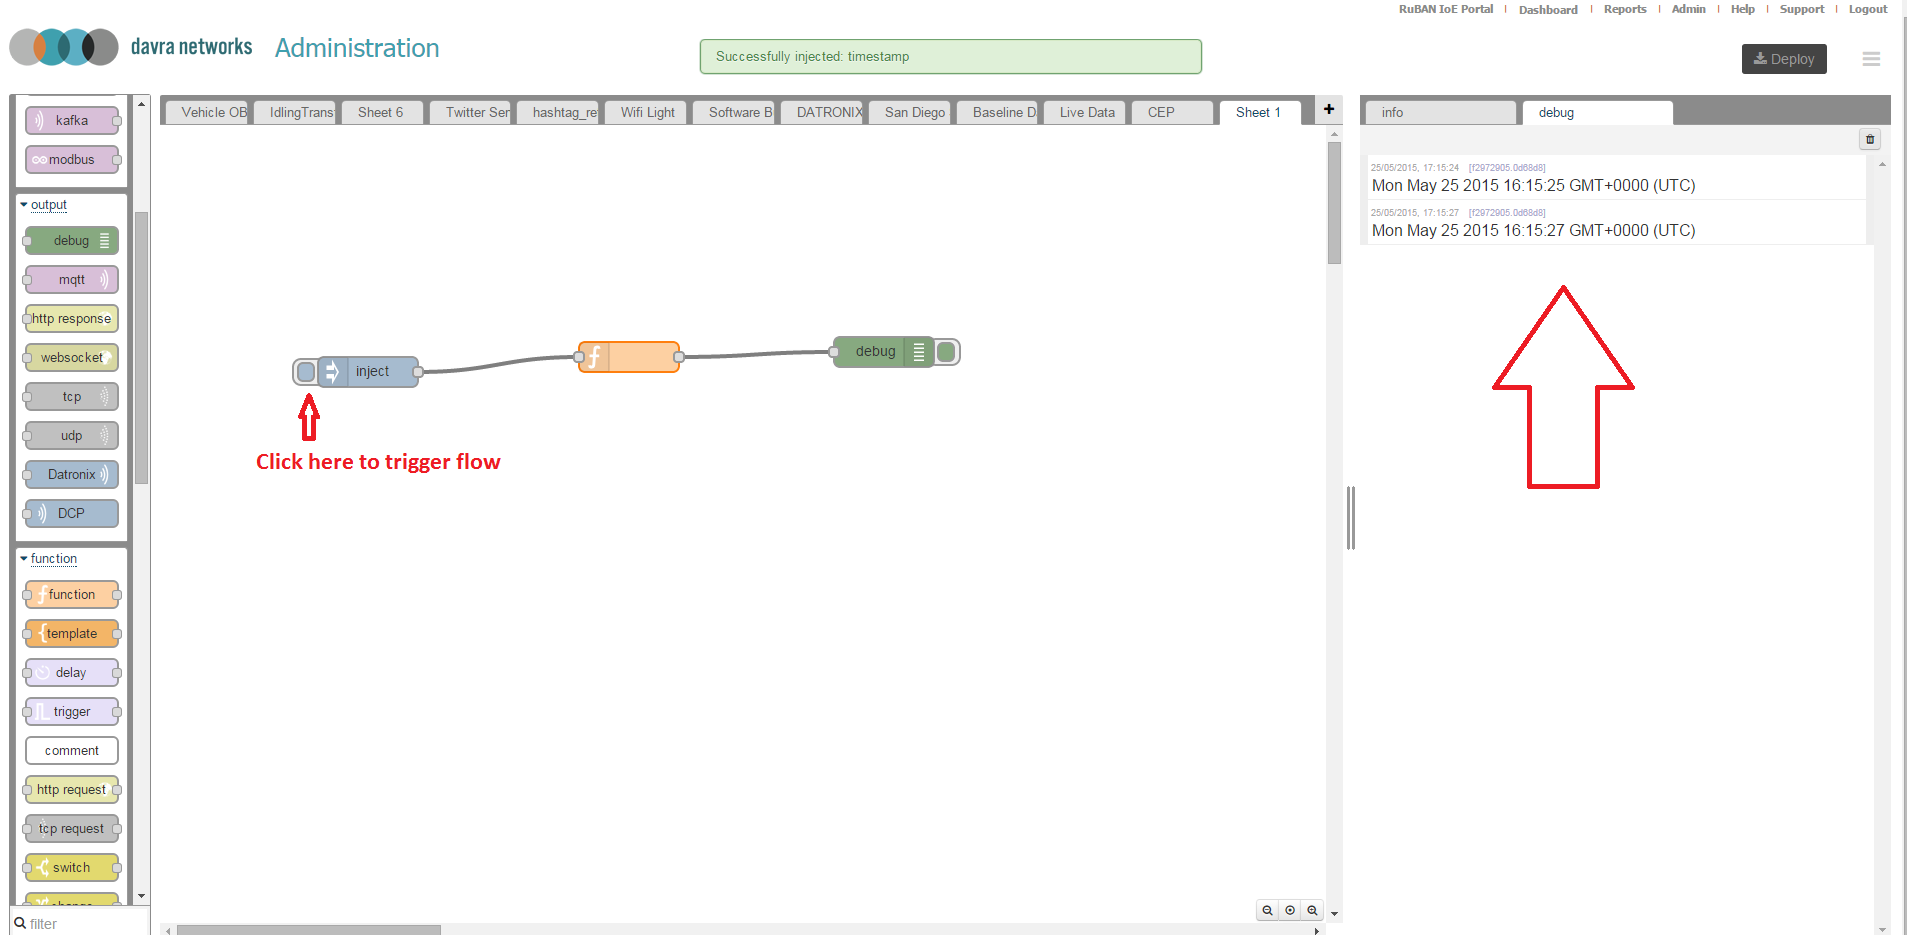
The first node we will use is the inject node. The Inject node allows you to inject messages into a flow, either by clicking the button on the node, or setting a time interval between injects. Drag one onto the workspace from the input section of the palette on the left hand side.
Select the newly added Inject node to see information about its properties and a description of what it does.
Next add a debug node, drag it from the output section of the palette on the left hand side. The Debug node causes any message to be displayed in the Debug sidebar. By default, it just displays the payload of the message, but it is possible to display the entire message object.
Connect the Inject and Debug nodes together by dragging between the output port of the inject node to the input port of the debug node.
At this point, the nodes only exist in the editor and must be deployed to the server. Click the Deploy button. Simple as that. With the Debug sidebar tab selected, click the Inject button. You should see numbers appear in the sidebar. By default, the Inject node uses the number of milliseconds since January 1st, 1970 as its payload. We will now display something a bit more useful.
There are many built in nodes that allow you to create defined connections and perform set functions over the flow, but very often you will need extra flexibility. This is where the function node comes in. The Function node allows you to pass each message though a JavaScript function. Wire the Function node in between the Inject and Debug nodes. You’ll need to delete the existing wire (select it and hit delete on the keyboard).
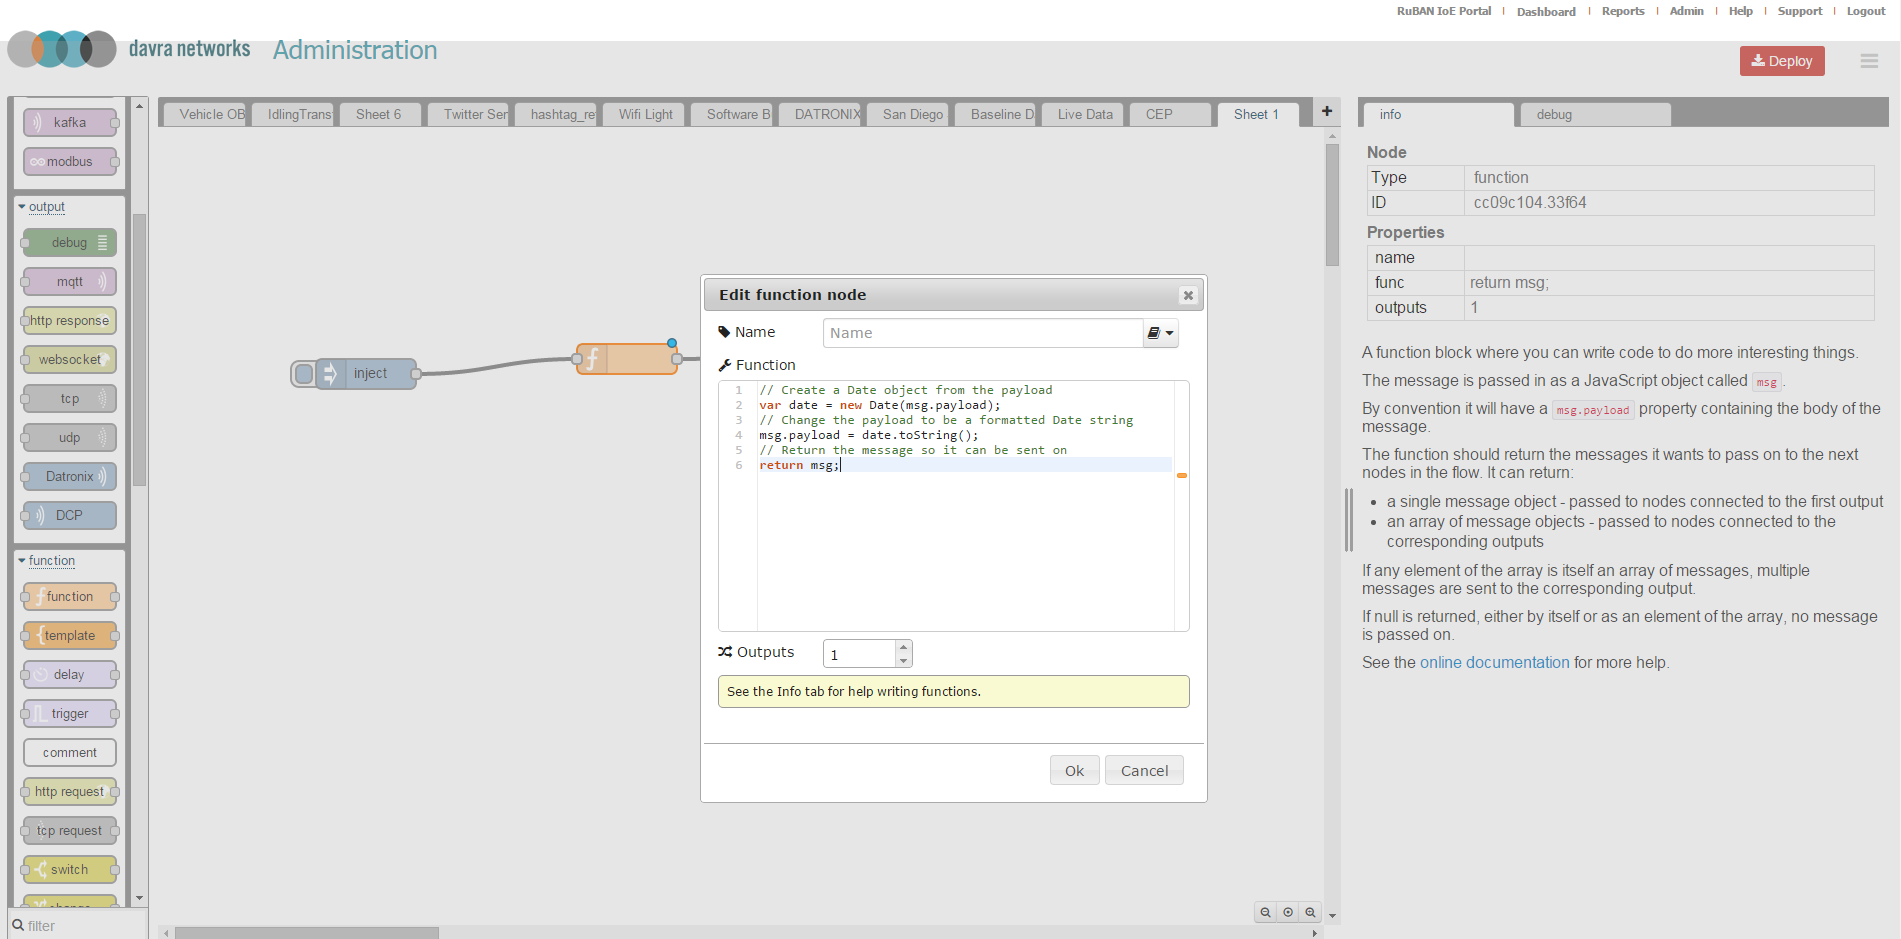
Double-click on the Function node to bring up the edit dialogue. Copy the follow code into the function field:
// Create a Date object from the payload
var date = new Date(msg.payload);
// Change the payload to be a formatted Date string
msg.payload = date.toString();
// Return the message so it can be sent on
return msg;
The IDE should look as follows:
Give the node a name also and select OK to close the dialogue, then in the top right hand corner select the "Deploy" button. Your flow is now active. Select the debug tab on the right hand side panel and then click the inject node to inject a message into the flow.
You will now see that the date is nicely formatted and not just a raw time-stamp. Your function has transformed the data message.
That is our full walk-through of the RuBAN System integrator development environment as well as a howto for deploying your first flow. You can use this IDE to create much more powerful transformations over data as well as connecting many different inputs to outputs.
Related articles