Circle gauge
- K (Unlicensed)
Under the dashboards components charting section you might find the Circle Gauge component (see picture below).
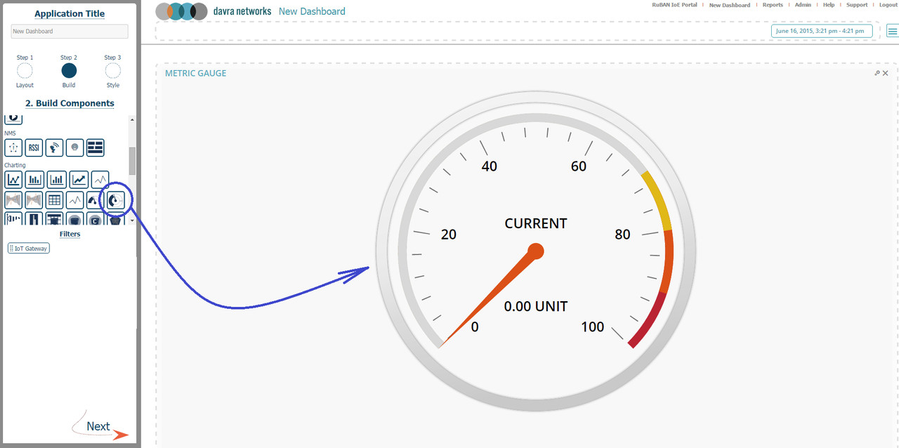
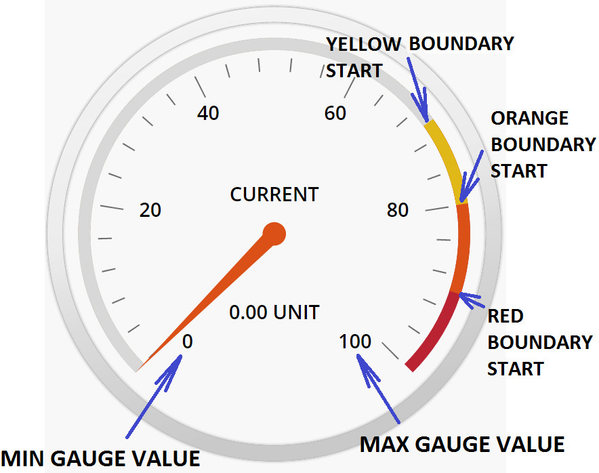
By default this component values follows as (see picture below):
- Min Gauge Value = 0
- Max Gauge Value = 100
- Yellow Boundary Start = 70
- Orange Boundary Start = 80
- Red Boundary Start = 90
-------------------------------------------------------------------------------------------------------------------------------------------
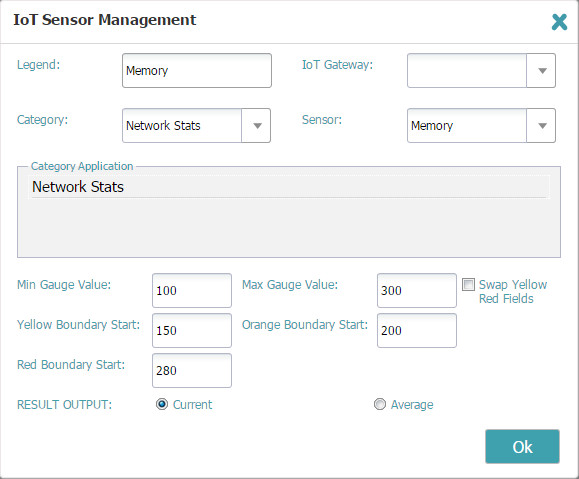
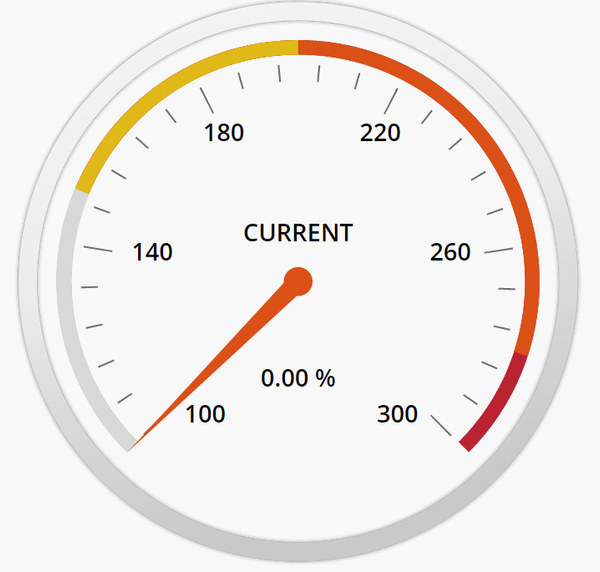
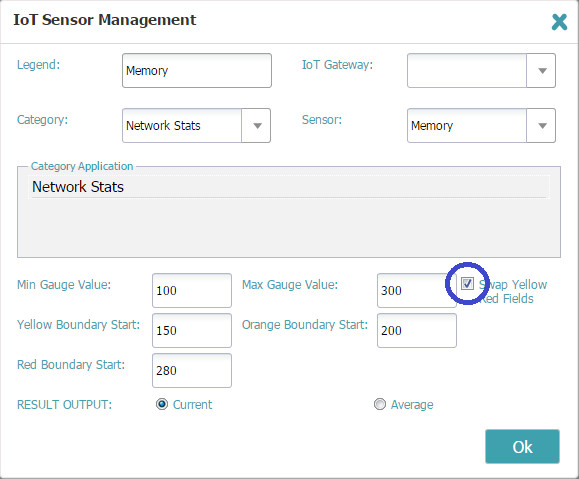
You have full control of these values and they can be easy changed with component editor (see picture below)
Note: Min value can not be bigger that max value. Boundary values should be in range between min and max value and yellow boundary can not be bigger than orange, and orange boundary value can not be bigger that red.
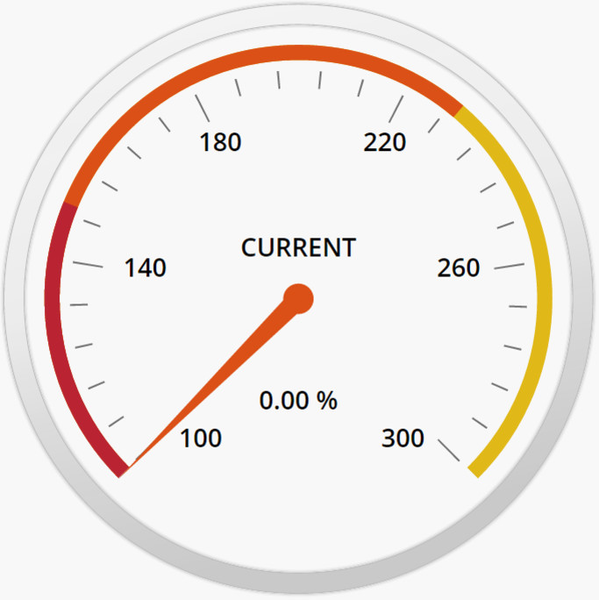
Result (see picture below):
-------------------------------------------------------------------------------------------------------------------------------------------
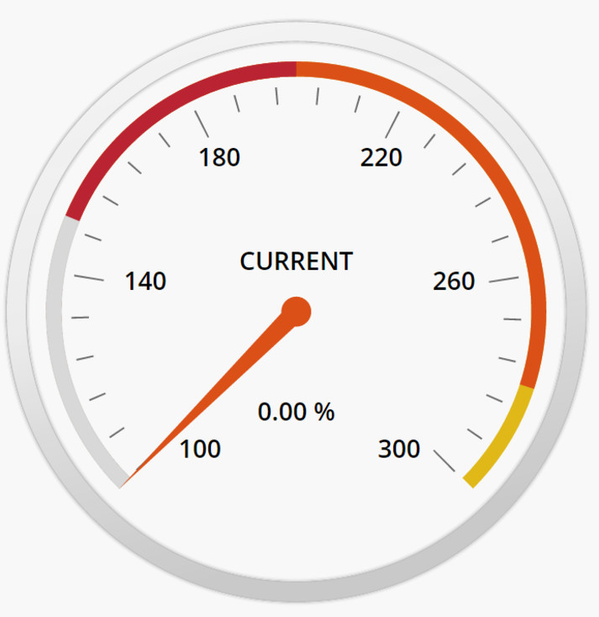
You are able to swap red and yellow gauge fields by selecting swap function from component editor (see picture below)
Result (see picture below):
-------------------------------------------------------------------------------------------------------------------------------------------
Note: It will not mirror the component, it will only swap colors (see picture below):


-------------------------------------------------------------------------------------------------------------------------------------------
In order to mirror the gauge you will need to swap yellow and red fields, and set yellow boundary value the same as min gauge value (see editor example below)
Note: if you swap the colors and set yellow boundary value same as min the grey gauge portion will be hidden.
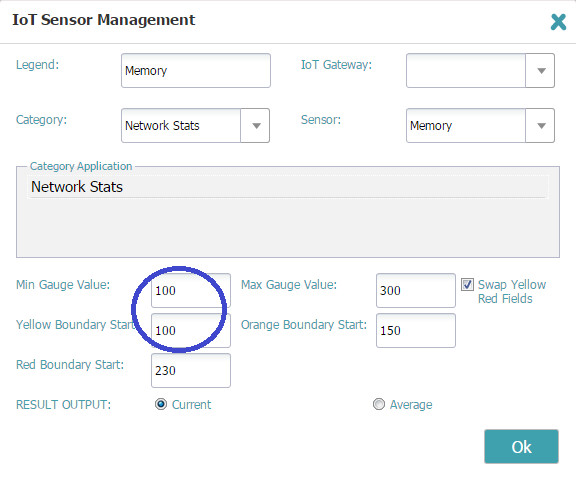
Result (see picture below):